Exposure to and nuisance from transport noise is shown in the Schulz Curve based on scientific data from the 1970s. The last in-depth evaluation and recalibration took place in 1992. However, more recent analyses have shown that aviation noise leads to people becoming annoyed at lower levels of noise than previously assumed. The internationally accepted Schulz curve underestimates current annoyances.
The FAA has conducted a nationwide survey in the United States on how people view the modern aviation fleet as it flies today. Best practices in noise analysis and data collection have been used. The responses from the survey were used to create a new curve. The results show that there has been a substantial change in the public perception of aviation noise compared to the Schultz curve.
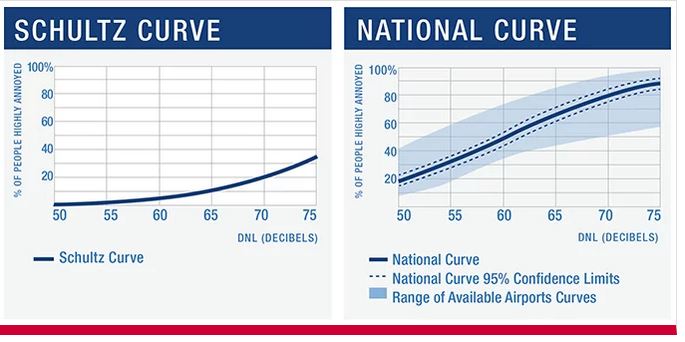
Compared to the existing Schultz Curve, the new National Curve shows a substantial increase in the percentage of people who are strongly annoyed by aircraft noise over the entire considered range of aircraft noise levels, also at lower noise levels.
Three times as many people suffer
For example, the classic Schultz curve shows that 30 percent of local residents experience nuisance at noise levels of 70 decibels. The new research shows that no less than 80 percent of citizens experience serious nuisance from such a noise level. That is almost three times the “official” figures for the aviation industry.
This means that the Schultz curve needs to be revised and that it does not do justice to the actual situation.
The new research, completed in February this year, clearly shows that at all noise levels between 50 and 75 decibels, there is a very significantly higher proportion of people affected by flight noise.
Broad survey
The FAA polled more than ten thousand residents living near twenty representative airports through a mail questionnaire. The questionnaire took the form of neighbourhood environmental survey and asked the recipient which environmental problems bother or irritate him / her. Aircraft noise was one of thirteen environmental issues addressed in the study. Since the aircraft noise question was only one of thirteen environmental problems listed, the recipient was unaware that this was in fact an aviation noise survey.
The data from the survey, the second largest survey of its type ever conducted, was used to calculate the new national curve and provides a contemporary picture of the response to aircraft noise exposure. Respondents were also asked by email to participate in a telephone follow-up survey. Just over 2,000 people agreed. The telephone survey was intended to provide additional insights into how people think about aircraft noise.
The FAA web publication takes a closer look at the methodology: airport selections, respondents, the questionnaire and noise modelling. There are also links to the technical and research report, to the Webinar about the report and a number of illustrations.